Earlier this year, Stella Laurenzo at AMD wrote a 4,500-word analysis proving that Claude Code had silently regressed, using data from nearly 7,000 sessions. Her work resonated hard. As of today (early June), the post has 2000+ thumbs-ups on GitHub, and it led to an official, public Anthropic investigation and postmortem.
I made a video breaking down her detective work and what it means for the rest of us.
The short version is that your coding agent can degrade without warning — from model updates, harness changes, or server-side bugs. And unless you’re capturing telemetry, you won’t know until you’ve burned through tokens and patience.
This post is the practical companion. Here’s the dashboard I built to surface those same regression signals in real time, and how to set it up.
Setup: 5 minutes with OpenTelemetry
Most major coding agents now support OpenTelemetry output — Claude Code, Codex, Gemini CLI, and others through plugins.
I’m using Pi with the @devkade/pi-opentelemetry extension. The entire setup is six environment variables:
export PI_OTEL_ENABLE=1
export OTEL_EXPORTER_OTLP_ENDPOINT="https://<your-endpoint>"
export OTEL_EXPORTER_OTLP_HEADERS="Authorization=ApiKey <your-api-key>"
export OTEL_SERVICE_NAME="pi-agent"
export PI_OTEL_PRIVACY_PROFILE=detailed-with-redaction
export PI_OTEL_PAYLOAD_MAX_BYTES=32768
The detailed-with-redaction privacy profile is a handy shortcut. It should help to capture enough signal for observability while redacting sensitive content from message bodies. You don’t want your agent’s telemetry to become a credential leak.
But be warned — it’s not completely bulletproof; I’ve seen credentials get logged through span names, for example, so be aware of the risks when you’re logging.
Once this is set, every session, turn, and tool call gets shipped to your Elastic instance as OTel traces and logs.
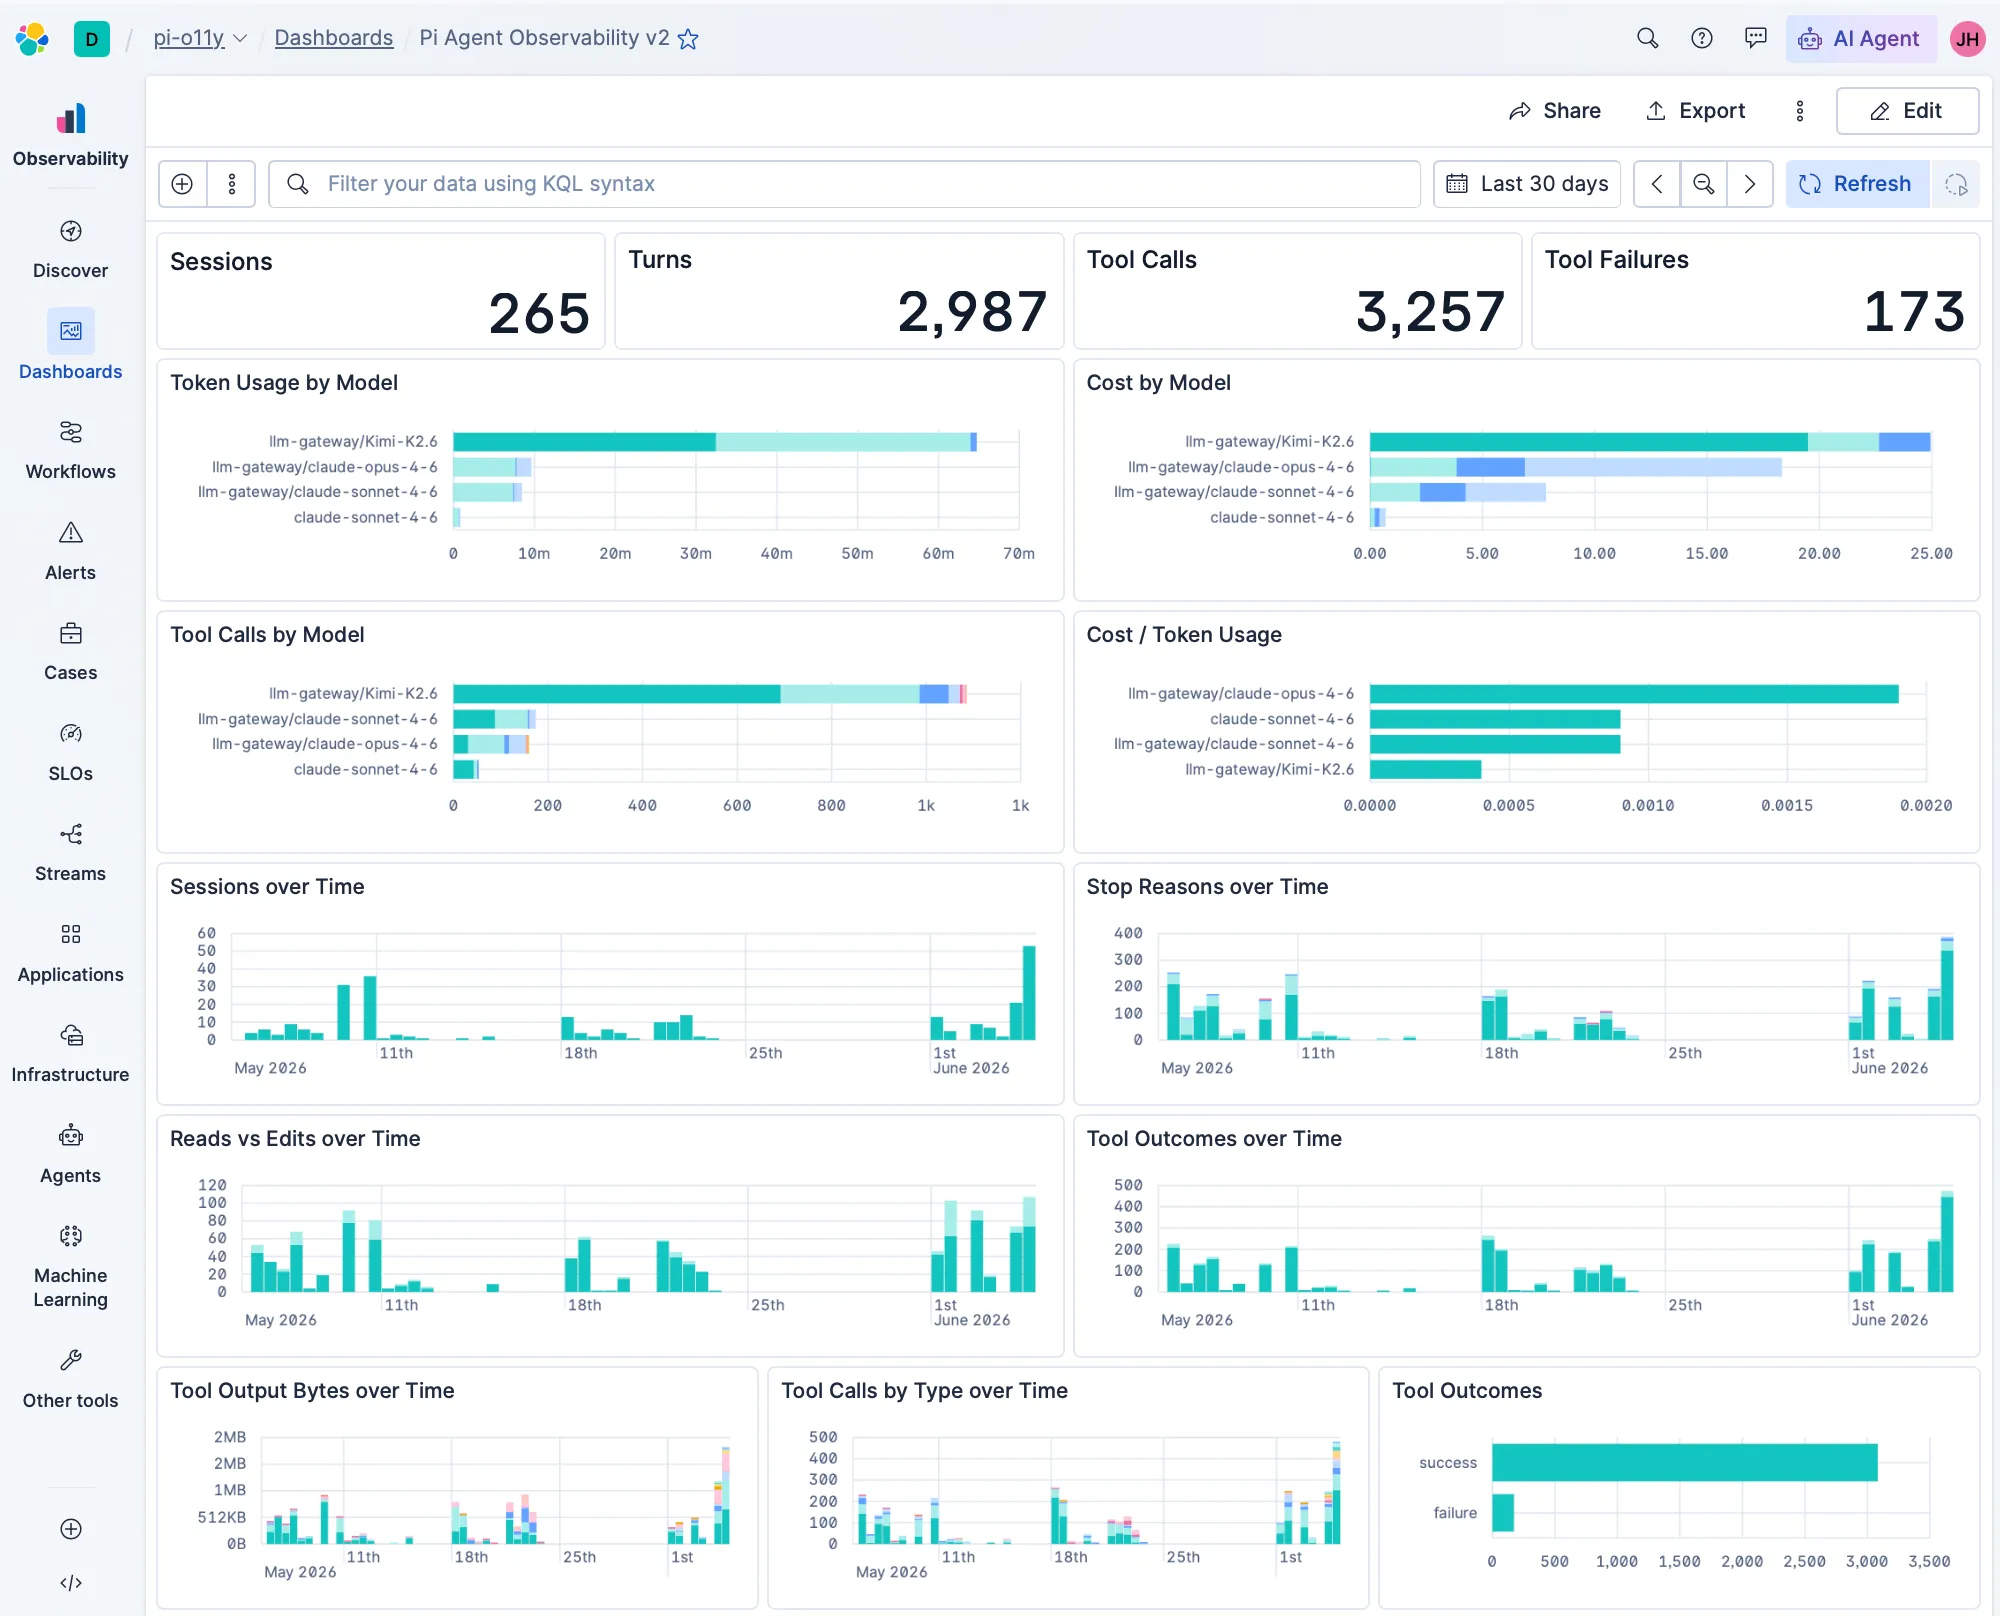
The dashboard
The dashboard has multiple layers, each designed to catch a different class of regression. I was inspired to follow the specific symptoms Laurenzo identified in her analysis.
Here are the key panels to watch, and what they tell you about your agent’s health:
Global metrics
Panels: Sessions, Turns, Tool Calls, Tool Failures

The baseline. These four numbers at the top give you the “is anything happening” sanity check, and the tool failure count is your first alert signal — if that number starts climbing relative to total calls, something is breaking.
Laurenzo signal: Tool failures spiking would have been an early indicator of the circular loops she found increasing from 8.2 to 26.6 per 1,000 turns.
Cost and token tracking
Panels: Token Usage by Model, Cost by Model, Cost per 1K Tokens
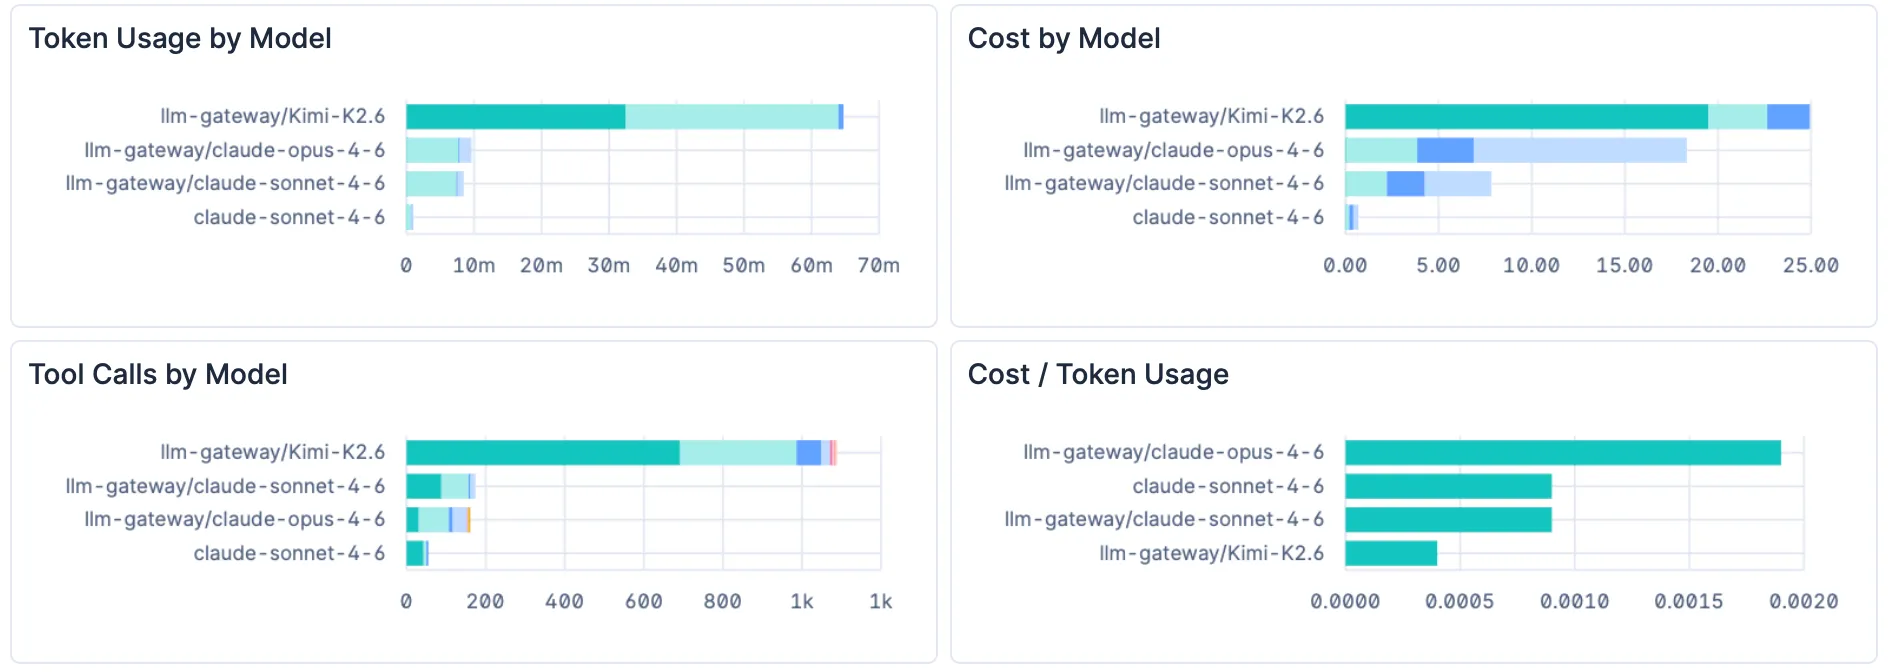
Laurenzo estimated that in her team, the daily token usage increased by over 100x between February and March for a similar number of prompts. These panels break down tokens and cost by model, so you’d see that spike immediately. And the cost-per-1K-tokens panel (built with an ES|QL query) tells you whether you’re hitting cache or not.
This is the equivalent of the multi-agent panel that caught a possible caching bug I found during my own testing. One harness was costing nearly 3x more than another on the same task, and the cost-per-token breakdown made it obvious.
Note: It is entirely possible I was doing something wrong here! But the point is, something is suboptimal and leading to added costs. Having a dashboard helped me to see that immediately.
Behavioural signals
Panels: Stop Reasons over Time, Reads vs Edits over Time, Tool Calls by Model & Tool Outcomes Over Time
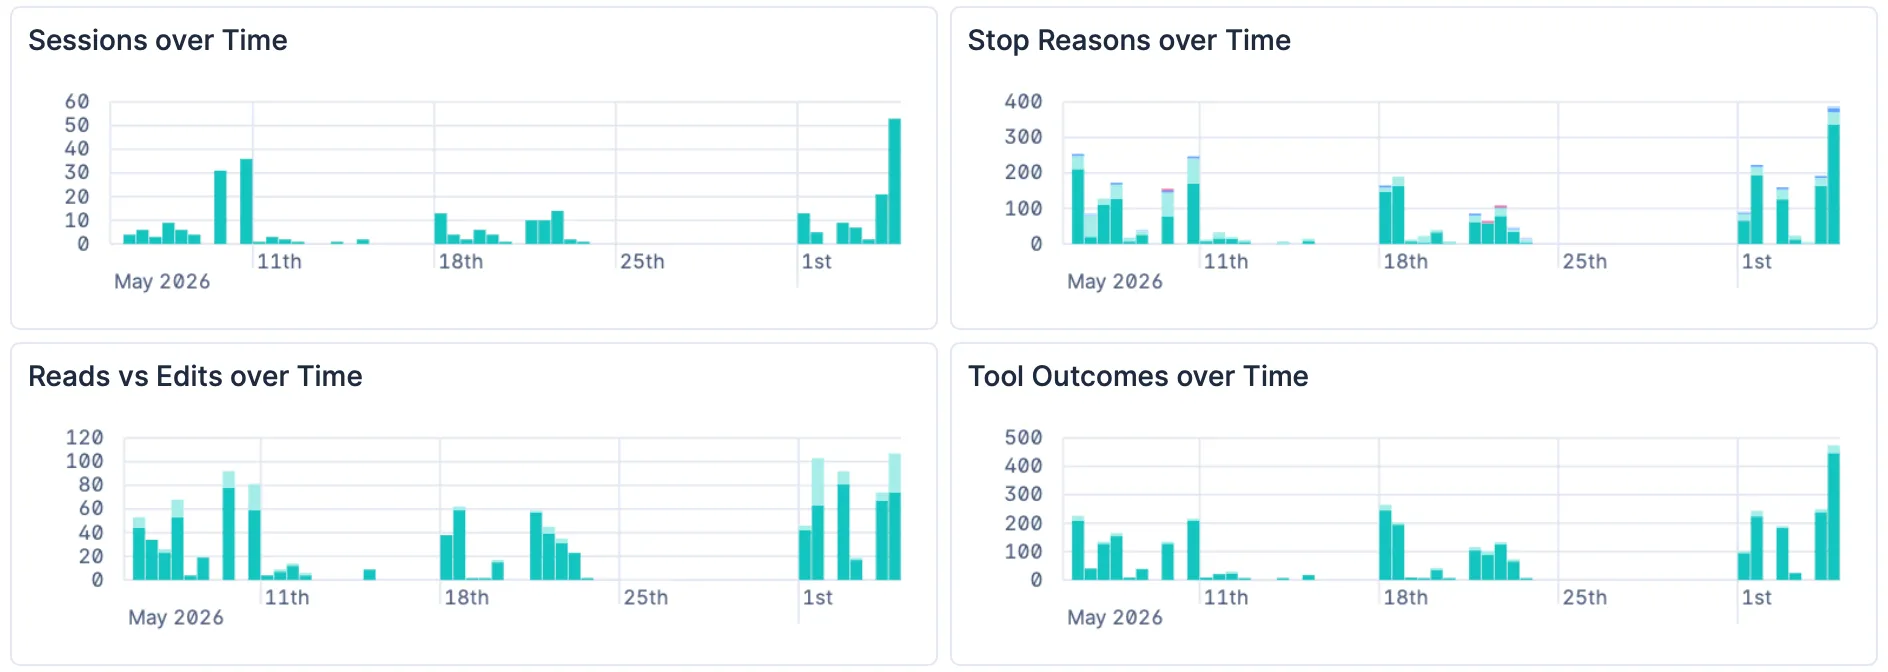
This is where the Laurenzo-style regressions live.
Stop Reasons tracks how each turn ends — did the model finish naturally, call a tool, or get manually interrupted? Laurenzo found manual interrupts spiking from 0.9 to 5.9 per 1,000 turns as engineers saw the model doing the wrong thing and yanked the chain. A spike in manual stops on this chart is exactly that signal.
Reads vs Edits is the big one. The read-to-edit ratio collapsing from 6.6 to 2.0 was Laurenzo’s most damning statistic — the model was fact-gathering 70% less before making changes. This panel shows read and edit tool calls over time, so a ratio shift shows up as a visible change in the bar proportions.
Tool Calls by Model gives you the broader picture — if the model stops using certain tools, or starts over-relying on others, the distribution shifts here.
Tool Outcomes surfaces changes in tool performance. If your “run code” tool starts failing more often, you’ll see it here.
Import the dashboard
The full dashboard JSON is available here as a gist.
My AI agent tells me that:
To import into Kibana:
**Management → Saved Objects → Import**, upload the JSON.
You'll need the `traces-generic.otel-*` and `logs-generic.otel-*`
data views to exist (they're created automatically when OTel data starts arriving),
plus two rollup indices (`pi-session-rollup` and `pi-session-tools`) for the cost and token panels.
But the secret sauce for me when working with Elasticsearch is the Elastic Agent Skills. This helps you with the syntax - in other words, I ask my agent what I need, and it does 90% of the work, if not more to get me there. Try it out. 😉
What I’d add next
This dashboard is a starting point. A few things I’m considering adding:
- Thinking block length over time — Laurenzo found thinking blocks were ~70% shorter in the degraded period. This is a strong signal if your agent’s OTel output includes thinking token counts.
- Cache hit ratio — the Anthropic postmortem revealed a caching bug that silently dropped thinking blocks. A cache ratio panel would surface this directly.
- Read-to-edit ratio as a dedicated line chart — right now you can eyeball it from the stacked bars, but a computed ratio over time would be cleaner.
- Alerting rules — Kibana alerts on any of these signals (e.g., “tool failure rate > 10% over 1 hour”) so the dashboard doesn’t need to be open to be useful.
The beauty of having the raw data in Elastic is that you can build whatever you need later. The dashboard doesn’t need to be perfect on day one — it just needs to exist.
And since I built this video and the dashboard, there’s been more plugins for Pi & OTel. Like this by one of our amazing Elastic colleagues Josh Mock. I’m looking forward to trying it out.
If you want the full story behind why this matters — the Laurenzo analysis, the caching bug I found, and the tradeoffs of agent observability — watch the video.
And if you build on this dashboard or add panels I haven’t thought of, I’d genuinely love to hear about it — find me on LinkedIn or Twitter or drop a comment on the video.